Data interpretation shortcut technique steps
Step 1:Observe the lengths of the bars of company A which
is increasing compared to company B
Step 2:Consider only the increasing bars ignoring others and see by how much it is increasing
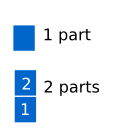
To check by how much it is increasing, count the number of parts and compare which has increased by less number of parts.
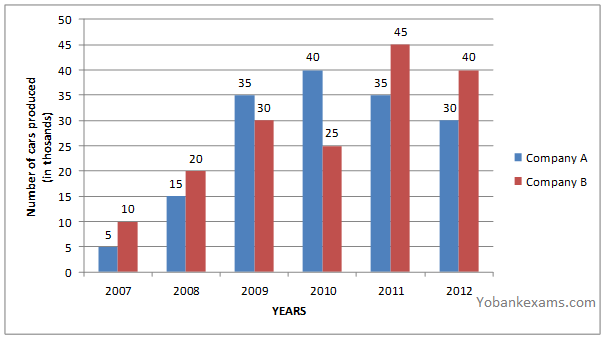
By looking at the above diagram we can say that the length of the bars of company A compared to company B has increased only in 2009 and 2010.
There is increase in production of company A only in the years 2009 and 2010.
We shall compare only 2009 and 2010 bars and ignore others
2009
 Number of parts of A=7
Number of parts of B=6
2010
Number of parts of A=8
Number of parts of B=5
Ans Percentage increase in production of company A to that of company B was minimum in 2009 as it has increased only by 1 part.
Another way of comparing is to just count the number of parts that is extra.
Example In 2009 by looking at the bars we can say that company A has 1 part more than company B.
In 2010 by looking at the bars we can say that company A has 3 parts more than company A.
So Percentage increase in company A is minimum in the year 2009.

