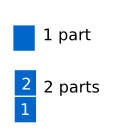
We shall see how we solve this using the below trick.
Steps to find percentage increase in production of company A
Step 1:Look at the graph and compare the lengths of the bars of company A for different years.
Step 2:Find out the year where the length of graph is less than its previous year.
We observe the following
(a) Production of company A from 2007 to 2010 shows an increasing trend and from 2010 to 2012 shows a decreasing trend.
(b)We shall consider only 2007 to 2010 ignoring others and start comparing the current year with its previous year
 Comparing 2008 and 2007
Number of parts in 2008=3
Number of parts in 2007=1
Increase=2
Comparing 2009 and 2008
Number of parts in 2009=7
Number of parts in 2008=3
Increase=4
Comparing 2010 and 2009
Number of parts in 2010=8
Number of parts in 2009=7
Increase=1
Ans Percentage Increase in production of company A is minimum in the year 2010 where it has increased by only 1 part compared to the year 2009.

